Excel data cleaning and exploration for 2Market
During my Data Analytics career accelerator course with LSE I used Excel to clean marketing data and perform exploratory analysis for 2Market, a fictional supermarket. The goal was to explore age of customers by country, marital status and income bracket.
The full spreadsheet can be downloaded here
Data cleaning
The data was supplied in csv format. I used Excel to check for duplicates and missing values. I also converted cells to their appropriate data type e.g. currency for Income.
For the dt_Customer field I first applied the mm/dd/yyyy date format to the column, but this did not achieve the desired result as some data showed as text and some as dates.
I then used TEXTSPLIT on the “/” to extract the three parts of the text. I then used DATE to format this into a date and applied the mm/dd/yyyy format to that column.
The data only had a birth year, so I derived an approximate age by assuming a date of birth of 1st July and using the DATEDIF function to find the difference between that assumed birth date and NOW.
Analysis
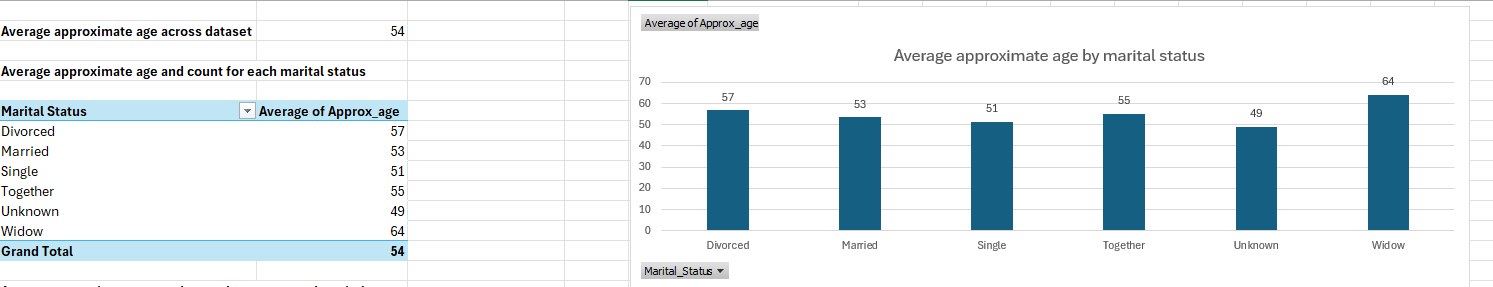
I created several pivot tables and charts from the data. A selection are shown below as screenshots but there are many more in the Excel file.
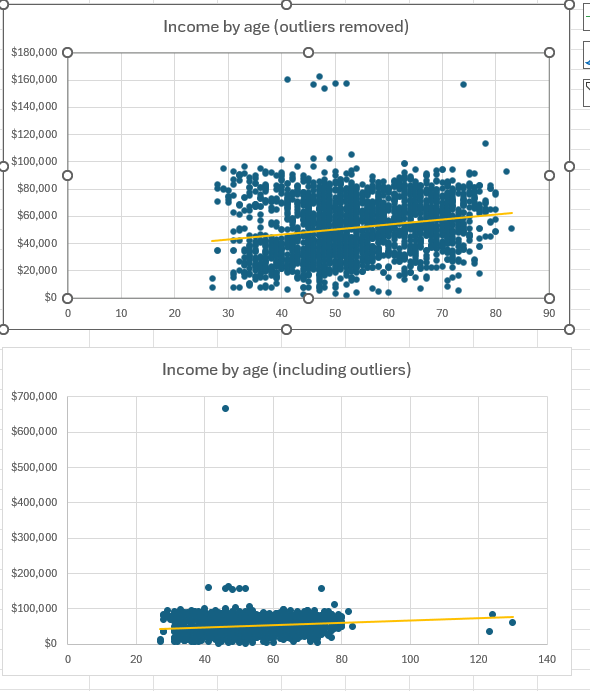
For income by average age, I created two scatterplots, one with outliers (age >110 or income > 200000) removed and one including outliers and applied a linear trendline to both plots. I created $10000 groups for income in the pivot tables and resulting charts.